When you leave your server a tip, do you round it to a whole-dollar amount and often in multiples of $5? Does a 60th birthday seem more significant than a 59th? If you answer yes to these questions, you’re not alone. Most of us prefer round numbers.
This preference leads many investors to review results by calendar year and to consider 10-year periods when evaluating long-term returns. People tend to place greater emphasis on the latest period due to recency bias and tend to extrapolate recent results into the future. For these reasons, we should put recent performance into the proper perspective.
During the most recent 10 years, equities delivered relatively strong performance amid volatility and uncertainty, with the MSCI All Country World IMI Index earning an annualized return of 8.49% through 2022. Within equities, higher-profitability stocks generally outperformed lower-profitability stocks globally and small caps outperformed large caps in regions outside the US, while the underperformance of value stocks garnered a lot of attention.1,2 Despite a strong rebound from late 2020 through 2022, the MSCI All Country World IMI Value Index underperformed the market, delivering an annualized 7.25% over the same 10-year period.3
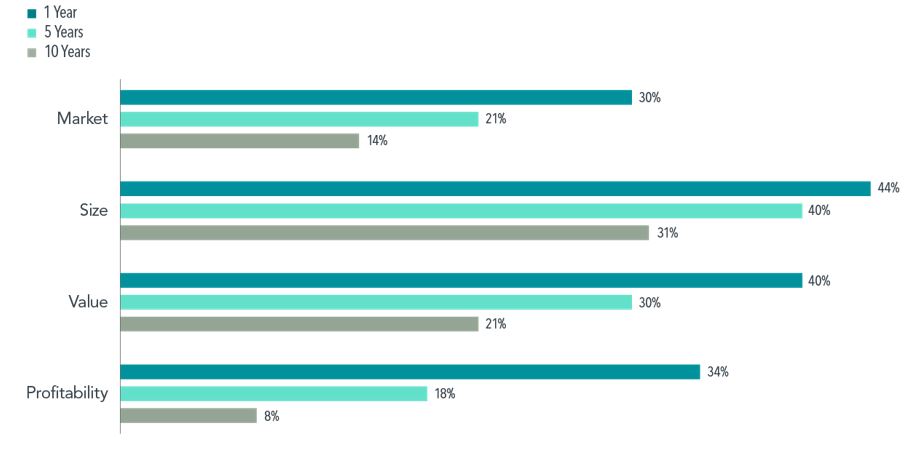
We expect positive market, size, value, and profitability premiums, but also recognize that realized premiums are volatile and can sometimes be negative. Although a negative premium can be disappointing, it is not unprecedented—and we can look at historical data to gauge how often each premium has been negative. For example, Exhibit 1 shows the percentage of rolling one-, five-, and 10-year periods with negative premiums, going as far back as the data are available. As you can see, negative premiums occur from time to time. While a positive premium is never guaranteed, the odds of realizing one are decidedly in your favor and improve the longer you stay invested.
EXHIBIT 1 – How Often Have Premiums Been Negative?
Percentage of rolling one-, five-, and 10-year periods with negative premiums, US market through December 31, 2022
This analysis looks at each premium individually. What if you integrate all four premiums in pursuit of higher expected returns? A different approach is to calculate the frequency of one, two, three, or all four premiums being negative over rolling 10-year periods from July 1963 to December 2022. In almost half of the rolling 10-year periods, we observe one negative premium out of four premiums. However, the premiums do not move in lockstep, so there were fewer instances of two negative premiums and no instances of three or four negative premiums.
Any premium that doesn’t materialize will get called into question. Plenty of ink will be spilled scrutinizing the one that had the bad draw, even if that’s all it was.
The value premium has been under the microscope lately, but the other premiums have had their turns historically.
From an empirical perspective, a negative 10-year premium is not so far outside the range of outcomes as to suggest that the premium no longer exists. More importantly, we have a sensible framework for expecting positive size, value, and profitability premiums. That framework is valuation theory, which posits that a stock’s price reflects the company’s expected future cash flows discounted to present value. The discount rate equals an investor’s expected return.
Therefore, if stocks have different expected returns, those with lower prices and higher expected cash flows should have higher expected returns. This framework holds regardless of whether realized premiums have been positive or negative in the recent past.
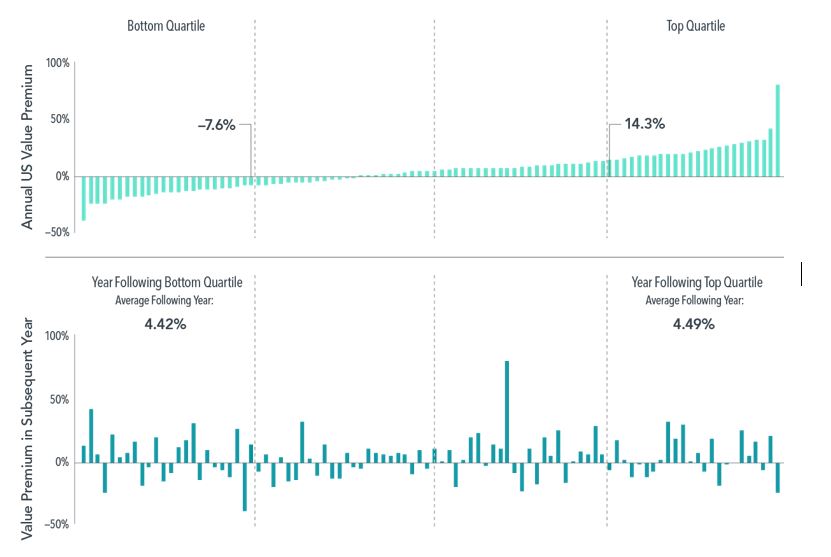
Over shorter horizons, the past performance of premiums doesn’t tell us much about future premiums either. For example, Exhibit 2 examines value’s performance from one calendar year to the next. Interestingly, the average annual value premium following the top quartile years—those with the strongest value performance—was roughly the same as the value premium in the year following the bottom quartile—or the weakest years for the value premium. If your goals and risk tolerance haven’t changed, then your asset allocation likely doesn’t need to change.
EXHIBIT 2 – Does Value Last Year Tell Us About This Year?
Annual value premiums and subsequent-year value premiums, US market, 1927-2022
The moral of the story? Negative outcomes are disappointing, but investors should view them with the proper perspective and stay the course.
FOOTNOTES
1 The performance of small caps vs. large caps is based on the Dimensional US Small Cap Index vs. the S&P 500, the Dimensional International Small Cap Index vs. the MSCI World ex USA Index, and the Dimensional Emerging Markets Small Cap Index vs. the MSCI Emerging Markets Index. The performance of higher-profitability stocks vs. lower-profitability stocks is based on the Fama/French high-profitability indices vs. the Fama/French low-profitability indices in the US, developed ex US markets, and emerging markets.
2 Wiebke Lamping and Namiko Saito, “Proof in Practice: Applying Profitability Research to Real-World Solutions”, research paper, Dimensional Fund Advisors, August 2023.
3 Wes Crill, “Value’s Rebound Rewarded Investors Who Stayed in Their Seats,” Insights (blog), Dimensional Fund Advisors, August 2022

John, a New Hope, Pennsylvania native, is the Founder and CEO of Rockwood Wealth Management. A former nuclear engineer, he is committed to the development and growth of conflict-free comprehensive financial planning and investment management. John values a client-centric practice and unwavering integrity in all of our endeavors as stewards of our clients' best interests.